Thumb vs AVR Performance
Tue, Oct 23, 2018The other day, I was working on an embedded application for driving stepper motors. In order to control my motor drivers, I was using the popular Atmega 328p MCU to speak with the host over serial, calculate paths, and pulse the stepper driver ICs at varying rates to control the speed of the system. Everything was working well, but I was beginning to run up against the limit of what the AVR could do in between the pulses of the motor clock, which at full tilt would request a motor update at 20KHz per motor. Since I’d been experimenting with the STM32 series of ARM based microcontrollers for other applications, I decided to spin a similar motor controller board based on the value line STM32F070 MCU, running at a respectable 48MHz (compared to the 16MHz of the AVR). My naïve assumption was that after porting the lower level parts of the code, I’d be able to deploy to the new MCU and immediately see a dramatic improvement in performance from the higher clock speed.
I was wrong.
When I deployed the code with only a single axis enabled, the MCU wasn’t able to keep up at all - the motor ready interrupt was firing at 20KHz, but the main event loop of the application, even heavily pared down to just the critical motor speed control code, was only able to execute at around 7KHz. What gives! In order to try and figure out where the performance gap is, I started off by writing a very simple benchmark loop for both devices - set a pin high, loop an 8 bit value from 0 to 255, and then clear the pin. Let’s start with the AVR version of the code:
void __attribute__ ((noinline)) test_loop() {
    PORTD |= (1 << DDD1); // Set indicator pin
    // Loop from 0..255. Include a NOP so that the compiler doesn't
    // (rightly) eliminate our useless loop.
    for (uint8_t i = 0; i < 0xFF; i++)
        asm __volatile__("nop");
    PORTD &= ~(1 << DDD1); // Clear indicator pin
}
AVR Cycle-counting
After compiling with avr-gcc -O2, we can disassemble with objdump to take a
look at what’s actually running on our AVR core. As we’d expect, it’s fairly
straight forward: the AVR instruction set has single-opcode bit set/clear ops,
so the first and last lines become single instructions. The loop then consists
of one initialization and three repeated instructions. Comments have been added
below to explain each instruction:
00000080 <_Z4loopv>:
  80:   59 9a           sbi     0x0b, 1 ; 11    ; Set indicator pin
  82:   8f ef           ldi     r24, 0xFF       ; Load loop variable (255)
  84:   00 00           nop                     ; Loop body (nop)
  86:   81 50           subi    r24, 0x01       ; Subtract one from loop counter
  88:   e9 f7           brne    .-6             ; Jump back to loop label
  8a:   59 98           cbi     0x0b, 1 ; 11    ; Clear indicator pin
  8c:   08 95           ret                     ; Done
Now, let’s get a read on how fast this can run. I loaded it onto another of the
same Atmega3 328p chips, let it run and measured the output signal on the logic
analyzer. Each high section of the output waveform was a very consistent
63.88µS. This is all very well and good, but let’s prove to ourselves that
this is a correct measurement. Since our cores aren’t doing any fancy
prefetching/pipelining, we should be able to reason fairly well about how many
cycles we expect assembly code to take.
So let’s turn to the
AVR instruction set datasheet:
according to the tables in here, it seems
we can expect the loop instructions subi and nop to execute in a single
clock cycle, and the brne instruction to execute in 2 cycles if the condition
is true (i != 0). Armed with this, we can check our measured number
by calculating the expected clock cycle count:
                   1 // sbi
                   1 // ldi
   255 * (1 + 1 + 2) // nop + subi + brne (taken)
+                  1 // cbi
---------------------------
                1023 // Total instructions
At a clock speed of 16MHz, this should take 63.93µS. This lines up very nicely with our measured number! Now let’s take a look at our surprisingly underperforming ARM core.
ARM Performance test
Like before, we’re going to use a very simple loop. The only difference here is
that we’ve replaced our AVR port manipulation logic with the STM32 equivalent.
As before, we will compile with the -O2 flag.
void __attribute__ ((noinline)) test_loop() {
    GPIO_BSRR(GPIOB) = GPIO8; // Set indicator pin
    for (uint8_t i = 0; i < 0xFF; i++)
        asm __volatile__("nop");
    GPIO_BSRR(GPIOB) = GPIO8 << 16; // Clear indicator pin
}
Now, let’s flash that to our ARM core. Since it’s operating at a whopping 48MHz
instead of the puny 16MHz of our AVR core, surely we’d expect it to execute our
test loop in around (64 / (48/16)) = 21.3µS?
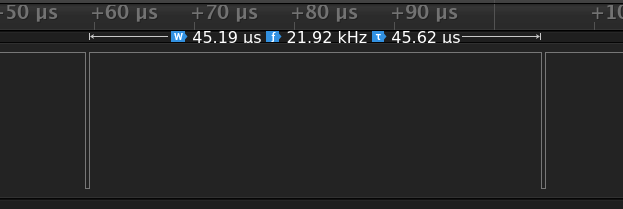
Spoiler alert: it does not
45.19µS! That’s almost half the speed we’d expect with a similarly implemented loop. Let’s take a look at the disassembly of our ARM loop and see what we can see (comments added on right):
080000c0 <_Z4loopv>:
 80000c0:       2280            movs    r2, #128        ; Load 0x80
 80000c2:       4b07            ldr     r3, [pc, #28]   ; Load GPIOB memory address
 80000c4:       0052            lsls    r2, r2, #1      ; Logical shift 0x80 left once to get 0x100
 80000c6:       601a            str     r2, [r3, #0]    ; Store 0x100 into GPIOB memory addr (set indicator)
 80000c8:       23ff            movs    r3, #255        ; Load loop variable
 80000ca:       46c0            nop                     ; Loop body
 80000cc:       3b01            subs    r3, #1          ; Subtract one from loop counter
 80000ce:       b2db            uxtb    r3, r3          ; Extend 8 bit value to 32 bit
 80000d0:       2b00            cmp     r3, #0          ; Compare to 0
 80000d2:       d1fa            bne.n   80000ca <_Z4loopv+0xa> ; Jump back into loop if != 0
 80000d4:       2280            movs    r2, #128        ; Load 0x80
 80000d6:       4b02            ldr     r3, [pc, #8]    ; Load GPIOB memory address
 80000d8:       0452            lsls    r2, r2, #17     ; Left shift again to get bit 8 set
 80000da:       601a            str     r2, [r3, #0]    ; Clear GPIOB pin 8
 80000dc:       4770            bx      lr              ; Return
 80000de:       46c0            nop                     ; (Dead code for alignment)
 80000e0:       48000418        stmdami r0, {r3, r4, sl}; GPIOB memory mapped IO location
The core of our loop seems pretty similar to the AVR: we execute a nop,
a subtract, compare and a branch.
We also have a sign-extend instruction on our loop counter in r3, which we
can eliminate by converting our uint8_t loop counter to a
uint32_t.
But there are some goings on
in the lean-in and lead-out that are a bit confusing - such as why are we
loading 0x80 and left shifting it instead of loading 0x100?
The answer is that
our ARM core isn’t actually running the ARM instruction set - it’s running in
Thumb mode.
Thumb mode
One of the downsides of a RISC ISA is that you tend to need more
instructions in your binary than you would on a CISC ISA with more operations
baked into silicon as a single opcode. For embedded and other space-sensitive
applications, having lots of 32-bit ARM instructions can waste precious program
ROM. To get around this, ARM created the Thumb instruction set, with (mostly)
16-bit instructions. So long as you’re mostly using common instructions, this
can easily close to double your instruction density! But like all things, there
are tradeoffs. One visible here is that the movs Thumb instruction only
supports immediate values in the range [0..255], so loading our bit constant
(1 << 8) cannot be done as a single movs - we have to load (1 << 7) and
then shift it once more once it’s loaded to a register. The alternative for
loading constants is what’s been done by GCC for the memory-mapped IO region
for port B, which is to embed it as part of the function below the bx lr
return call - 0x48000418 is our MMIO location, which is loaded using
ldr r3, [pc, #28] to load a full word constant from memory. Presumably our
0x100 constant is not big enough for GCC to think it worth using the
same trick here.
So let’s calculate our our cycle counts for the ARM code as we did for the AVR, using this list of instructions. We have a couple cycles overhead for our lead in and lead out, but the core of our loop has the following cycle characteristics:
80000c0:       2280            movs    r2, #128        ; 1 cycle
80000c2:       4b07            ldr     r3, [pc, #28]   ; 2 cycles
80000c4:       0052            lsls    r2, r2, #1      ; 1 cycle
80000c6:       601a            str     r2, [r3, #0]    ; 2 cycles
80000c8:       23ff            movs    r3, #255        ; 1 cycle
80000ca:       46c0            nop                     ; 1 cycle
80000cc:       3b01            subs    r3, #1          ; 1 cycle
80000ce:       b2db            uxtb    r3, r3          ; 1 cycle
80000d0:       2b00            cmp     r3, #0          ; 1 cycle
80000d2:       d1fa            bne.n   80000ca         ; 3 if taken, 1 if not taken
80000d4:       2280            movs    r2, #128        ; 1 cycle
80000d6:       4b02            ldr     r3, [pc, #8]    ; 2 cycles
80000d8:       0452            lsls    r2, r2, #17     ; 1 cycle
80000da:       601a            str     r2, [r3, #0]    ; 2 cycles
80000dc:       4770            bx      lr              ; 3 cycles
Calculating it out, that’s approximately 7 + (7 * 255) + 6 = 1,789 cycles! Close to double
the count of our AVR code. At 48MHz, that’s a theoretical execution time of
37.27µS. Our actual measured time (45.19µS) is somewhat slower - my
assumption is that this is due to flash wait states, as the STM32F070 this test
was run on has 1 wait state for clock speeds > 24MHz. These delays should only
be incurred for non-linear flash accesses, and so our repeated loop branching
is a worse-case scenario here. Inserting an extra cycle
into our loop for a prefetch miss results in a total cycle count of 2,053, and
an expected runtime of 42.77µS, which is much closer to our measured time.
What should I take away from all this
At the end of digging into all this, I have a newfound respect for the AVR architecture - single cycle IO access makes it much more competitive for applications with lots of standalone IO calls (but perhaps not for standard protocols like SPI, which tend to be offloaded to baked-in peripherals on the ARM cores, and with DMA support can be extremely powerful). It’s also useful to be aware of the limitations and quirks of the Thumb instruction set - keeping constants small, avoiding spurious resize instructions and minimizing branches are ways to eke more performance out of tightly looped controllers. If I were to summarize some key takeaways, they might be:
- A higher clock speed doesn’t necessarily mean more performance
- Cycle count estimations can be useful for ballpark runtime calculation
- If you need to know for sure, measure it! It’s easy to make mistaken assumptions, but luckily it can also be simple to verify them.