STM32 & OpenCM3 5: Debugging & Fault Handlers
Sat, Aug 17, 2019 Companion code for this post available on GithubThis is the sixth post in a series on the STM32 series of MCUs. The previous post, on memory sections and ITCM, can be found here.
When building embedded software, it can sometimes be challenging to determine the root cause of a failure. You have no operating system to fall back on, and if you are coming from a non-embedded background may not know about some of the low-level behaviours that can be leveraged to make finding certain bugs a little easier. In this post, I’ll go over in detail the steps to connect an interactive debugger to your embedded system, as well as how you can make interrupt problems easier to diagnose.
Connecting using GDB
If you have worked on applications software in either C or C++ for some time, here’s a good chance you will at least have heard of GDB. As one of the more venerable debuggers, it supports an incredible number of targets, including (to my knowledge) the entire ARM Cortex ecosystem.
There are a plethora of ARM programming and debug adapters on the market, such as:
- Segger J-Link
- ST-Link
- LPC-Link 2
- Black Magic Probe
- ARM’s own DSTREAM and ULINK probes
For the purposes of this post, we will be using the cheap and powerful Black Magic Probe (BMP). This probe comes with a standard 10-pin SWD header, and a 4-pin UART connector. Both of these have level-shifted output between 1.7 and 5V, and the probe can also supply 3.3V power to targets if necessary. Even better, the probe runs an implementation of the GDB server protocol, meaning that it can be connected to GDB with no additional software dependencies, unlike some other tools.
To get started with the black magic probe, you’ll first need to connect it to your device under test. For this you can use the included 0.127mm pitch SWD connector, or other standard cable such as the popular TagConnect TC-2050 cable, which eliminates the need for costly headers.
Two example connections of the probe, one with the included SWD cable, and one with a TagConnect cable, are shown here:
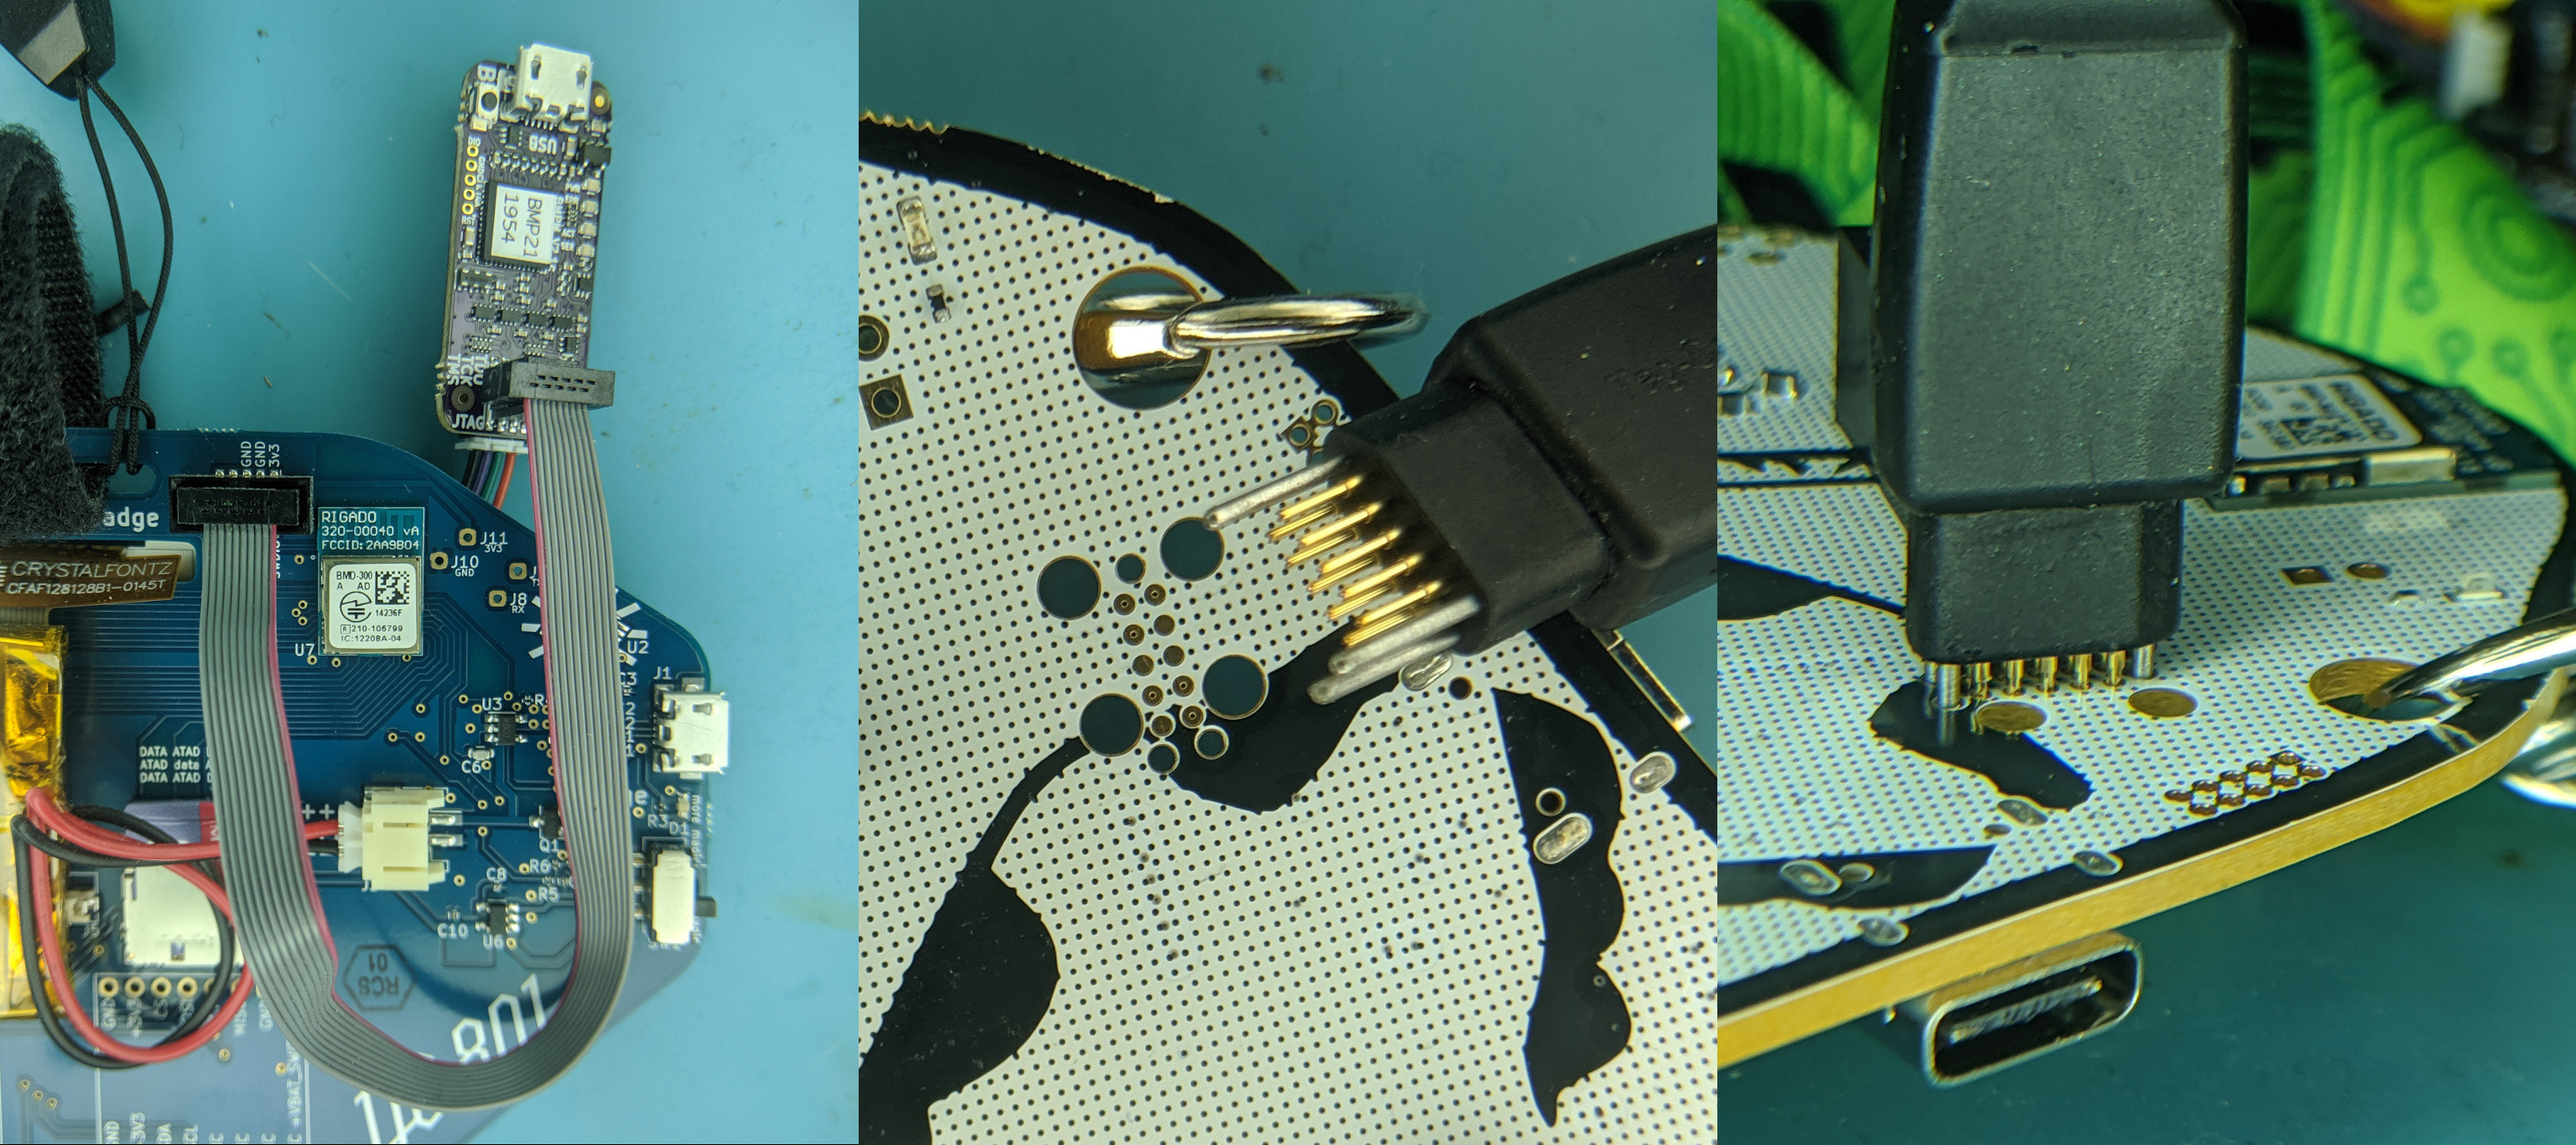
Example connections of Black Magic Probe
Once your cable is connected, and the device is powered up, it’s time to fire up GDB. If you don’t already have it, you can install it and the rest of the GNU ARM toolchain on Debian based systems with the following command:
sudo apt install binutils-arm-none-eabi gcc-arm-none-eabi gdb-arm-none-eabi
For other systems, you can install GDB by following the instructions here.
Now that we have GDB ready, we need to load up the program we’re debugging and connect to our probe. To do that, we first start GDB with the elf as our first argument:
$ arm-none-eabi-gdb my_program.elf
GNU gdb (7.12-6+9+b2) 7.12.0.20161007-git
Copyright (C) 2016 Free Software Foundation, Inc.
# Connect to the black magic probe as a target. There are two serial ports
# exposed by the device - the first is the GDB server, the second is a
# passthrough to the UART pins on the device. The exact path to the serial
# devices will vary by OS.
(gdb) target extended-remote /dev/ttyACM0
# Now that we have told GDB to use the BMP as a target, we can invoke
# some extra commands. The first will be to scan for serial wire debug targets,
# which should return the MCU that we wish to connect to.
(gdb) monitor swdp scan
# Now that we've scanned and identified the device we want to connect to, we
# can start debugging it by attaching. In this case we want the first (and only)
# target. Invoking the attach command will automatically halt the device and
# show the current stack frame.
(gdb) attach 1
If you find yourself typing in these commands a lot, I’d recommend putting them
all in a file called .gdbinit in your working directory. This will cause GDB to
automatically run them on startup, saving you some time if you are repeatedly
closing and reopening GDB to connect to the same system.
Note that you may need to set the configuration value
set auto-load safe-path /
in the .gdbinit in your home directory to allow loading of arbitrary
.gdbinit scripts. To be more secure, use a more specific path than /, otherwise
malicious source trees could cause you to run arbitrary GDB commands.
Now that we are connected to the device, we can interact with it almost as
though it were a program runnig on our local machine, but with a few extra
commands. I’ll list a couple things I use frequently here, but do consult the
GDB manual
both for more details about these commands and for other useful
invocations. All commands shown below can be shortened to the character in
[].
# Print an expression. Expression can be a variable, function, macro, etc.
> [p]rint myvar / MY_DEBUG_MACRO / *((uint32_t*)0xDEADBEEF)
# Exampine one or more memory addresses.
> e[x]amine my_array
> x/10ub 0xDEADBEEF # Print 10 unsigned bytes starting at 0xDEADBEEF
> x/s 0xDEADBEEF # Print the C-string starting at 0xDEADBEEF
# Breakpoints
> [b]reakpoint main # Create breakpoint on entry of method main()
> b my_code.cpp:123 # Create breakpoint at line 123 of my_code.cpp
> [d]elete 2 # Delete breakpoint number 2
# Memory watchpoints
> watch my_var # Trigger breakpoint if my_var changes
# Trigger breakpoint if the integer value located at 0xDEADBEEF changes
> watch watch *(int *) 0xDEADBEEF
# Control flow
> [n]ext # Advance execution to next line of code
> [ni] (next instruction) # Advance execution to next assembly instruction
> [c]ontinue # Run until breakpoint or user interrupt (ctrl-c)
> [r]un # Start program over from beginning
# Information
> info locals # Print all local variables and their values
> info registers # Print the contents of all CPU registers
> info breakpoints # Print all the currently active breakpoints
# Flashing
> file my_program.elf # Select the active binary
> load # Flash the microcontroller with the active file
> compare-sections # Verify the microcontroller code matches the active file
# Dump memory range 0x0 to 0xFFFF to file out.bin as raw binary data
> dump binary memory out.bin 0x0 0xFFFF
As an added tip, if your program is compiled using a makefile
any make commands entered inside of GDB will be run normally, allowing you to
rebuild and re-flash your microcontroller without ever leaving your GDB session.
Fault Handlers
While the GDB commands above should handle a lot of debugging needs, there will still be some cases (generally due to interrupts) where the control flow of the CPU is hard to follow. In cases like these, implementation of the ARM hard fault interrupt, as well as providing default implementations for all user interrupts, can be very useful.
If your code enables an interrupt but doesn’t implement the associated handler, or causes a processor fault by attempting to execute an invalid instruction or access invalid memory, the ARM core will jump to the Hard Fault Handler, which is an interrupt common to the entire Cortex-M family. Implementing this interrupt handler, and using it to provide error feedback, can save many hours of second guessing your code.
Generally, your HAL library (such as CMSIS, or in this example series, libopencm3) will provide a weakly linked implementation of these system interrupt handlers. In order to provide your own, all you need to do is implement it, which will override the weakly linked one in the HAL.
When you do implement the hardfault handler, the first thing you will want to
do is determine which stack pointer was in use when the program crashed (this
is mainly relevant for applications making use of an RTOS or other system that
takes advantage of multiple hardware stacks).
When an exception or interrupt handler is entered, the processor updates
the link register with a special value, EXC_RETURN. The full details of this
behaviour can be found in the
ARMv7-M reference manual
section B1.5.8, but for
our purposes the salient bit is bit 2, which determines whether the return
stack is the main stack, or a process stack. By testing the link register
against the pattern (1 << 2), we can determine which stack point was in use
when the exception occurred, and pass the appropriate one through to our
generalized exception handler.
I’ve seen a couple hardfault handler implementations online that require a CPU supporting conditional execution, which isn’t present on the Cortex-M0 series processors. Here’s a fault handler that should be generic enough to work on all ARMv7-M processors, at the cost of a few extra instructions:
void hard_fault_handler(void) {
  __asm(
    "MRS r0, MSP\n" // Default to the Main Stack Pointer
    "MOV r1, lr\n"  // Load the current link register value
    "MOVS r2, #4\n" // Load constant 4
    "TST r1, r2\n"  // Test whether we are in master or thread mode
    "BEQ base_fault_handler\n" // If in master mode, MSP is correct.
    "MRS r0, PSP\n" // If we weren't in master mode, load PSP instead
    "B base_fault_handler"); // Jump to the fault handler.
}
With this bridge method in place, we can write the meat of our fault handler code. We take as input the stack pointer address that was determined by our assembly bridge, and gather some pertinent information about the crash into local variables for inspection.
// Core ARM interrupt names. These interrupts are the same across the family.
static const char *system_interrupt_names[16] = {
    "SP_Main",      "Reset",    "NMI",        "Hard Fault",
    "MemManage",    "BusFault", "UsageFault", "Reserved",
    "Reserved",     "Reserved", "Reserved",   "SVCall",
    "DebugMonitor", "Reserved", "PendSV",     "SysTick"};

void base_fault_handler(uint32_t stack[]) {
  // The implementation of these fault handler printf methods will depend on
  // how you have set your microcontroller up for debugging - they can either
  // be semihosting instructions, write data to ITM stimulus ports if you
  // are using a CPU that supports TRACESWO, or maybe write to a dedicated
  // debug UART
  fault_handler_printf("Fault encountered!\n");
  static char buf[64];
  // Get the fault cause. Volatile to prevent compiler elision.
  const volatile uint8_t active_interrupt = arm::scb::ICSR & 0xFF;
  // Interrupt numbers below 16 are core system interrupts, we know their names
  if (active_interrupt < 16) {
    sprintf_(buf, "Cause: %s (%u)\n", system_interrupt_names[active_interrupt],
             active_interrupt);
  } else {
    // External (user) interrupt. Must be looked up in the datasheet specific
    // to this processor / microcontroller.
    sprintf_(buf, "Unimplemented user interrupt %u\n", active_interrupt - 16);
  }
  fault_handler_printf(buf);

  fault_handler_printf("Saved register state:\n");
  dump_registers(stack);
  __asm volatile("BKPT #01");
  while (1) {
  }
}
If you were to have GDB
attached to your microcontroller when this handler is hit, you will
automatically hit the breakpoint triggered by __asm volatile ("BKPT 01"), and
be able to get a summary of what went wrong by asking GDB for info locals,
as well as investigate the additional information printed out over our serial
console:
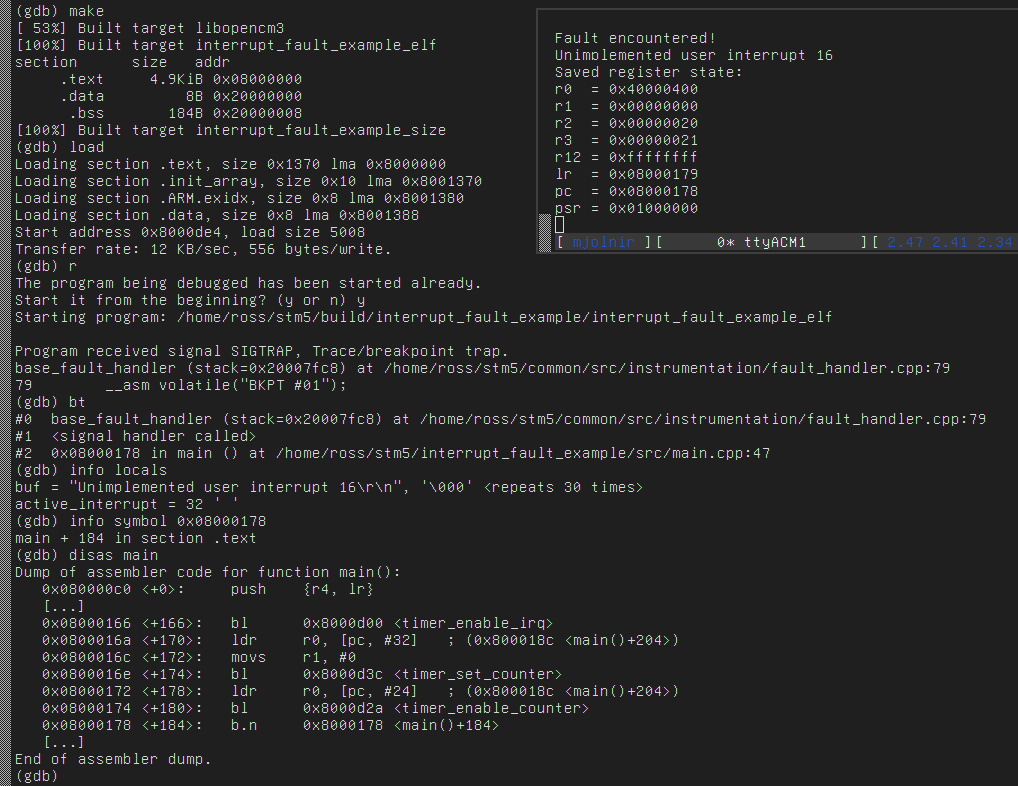
GDB info locals command output
In addition to the variables in the above method, we call a dump_registers method
to interpret and print the values of the calling stack frame that were saved by
the CPU before it jumped to the exception handler.
The list of registers, and the
order in which they appear, is listed in section B1.5.6 of the ARM reference
manual. We can use this info to generate some more debug output, like so:
enum { r0, r1, r2, r3, r12, lr, pc, psr };
void dump_registers(uint32_t stack[]) {
  static char msg[32];
  sprintf_(msg, "r0  = 0x%08x\n", stack[r0]);
  fault_handler_printf(msg);
  sprintf_(msg, "r1  = 0x%08x\n", stack[r1]);
  fault_handler_printf(msg);
  sprintf_(msg, "r2  = 0x%08x\n", stack[r2]);
  fault_handler_printf(msg);
  sprintf_(msg, "r3  = 0x%08x\n", stack[r3]);
  fault_handler_printf(msg);
  sprintf_(msg, "r12 = 0x%08x\n", stack[r12]);
  fault_handler_printf(msg);
  sprintf_(msg, "lr  = 0x%08x\n", stack[lr]);
  fault_handler_printf(msg);
  sprintf_(msg, "pc  = 0x%08x\n", stack[pc]);
  fault_handler_printf(msg);
  sprintf_(msg, "psr = 0x%08x\n", stack[psr]);
  fault_handler_printf(msg);
}
This works well as a generic fault handler, but there are some cases where we may want to also include some additional information. For example, if a memory fault occurs, there are several potential causes that we can flag up, as well as the address at which the fault occurred. So for handling memory faults, we could add a handler function such as the following:
void mem_manage_handler(void) {
  // Pull the MMFSR data out into variables for easy inspection
  // Variables are volatile to prevent compiler elision
  const volatile bool mmfar_valid =
      arm::scb::CFSR & arm::scb::CFSR_MMFSR_MMARVALID;
  const volatile bool fp_lazy_error =
      arm::scb::CFSR & arm::scb::CFSR_MMFSR_MLSPERR;
  const volatile bool exception_entry_error =
      arm::scb::CFSR & arm::scb::CFSR_MMFSR_MSTKERR;
  const volatile bool exception_exit_error =
      arm::scb::CFSR & arm::scb::CFSR_MMFSR_MUNSTKERR;
  const volatile bool data_access_error =
      arm::scb::CFSR & arm::scb::CFSR_MMFSR_DACCVIOL;
  const volatile bool instruction_access_error =
      arm::scb::CFSR & arm::scb::CFSR_MMFSR_IACCVIOL;

  // Pull the MMFAR address
  const volatile uint32_t mmfar_address = arm::scb::MMFAR;

  // Trigger a breakpoint
  __asm volatile("BKPT #01");
}
If you have an MPU and trigger a write violation, or try and perform operations
with an invalid alignment, you will trigger this method and like before can get
the problem at a glance with info locals:
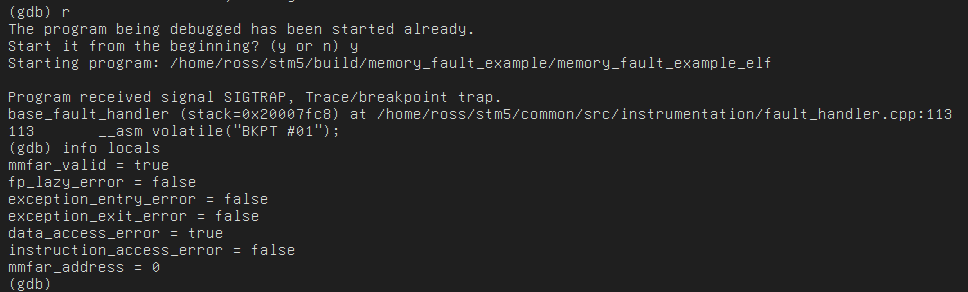
Memfault handler locals after null deference
In the output above, we can see that the MemManage Fault Address Register
(MMFAR) has been loaded with the address of the error, that the MMFAR address
is at 0x0, and that the access type was a data access. In other words, a null
pointer dereference!
If you want to have several exception vectors map to the same handler, a useful
trick is to alias those methods using an __attribute__
directive like so:
void bus_fault_handler(void) __attribute__((alias("hard_fault_handler")));
void usage_fault_handler(void) __attribute__((alias("hard_fault_handler")));
Keeping things clean
In order to keep my registers organized, I like to nest them in C++ namespaces instead of having a huge list of preprocessor macros (as can be seen in the methods above). In order to make defining registers simple, and still allow the compiler to optimize nicely, I use a template like the one below to generate references to each ARM register:
namespace arm {

// Convenience template for taking an integer register address and converting
// to a reference to that address.
template <typename T> constexpr T &Register(uint32_t addr) {
  return *reinterpret_cast<T *>(addr);
}

// Typedefs for register references of 32, 16 and 8 bits.
using Reg32 = volatile uint32_t;
using Reg16 = volatile uint16_t;
using Reg8 = volatile uint8_t;

} // namespace arm
Using that template, we can then go through and quickly define each of the registers in the ARM System Control Block (SCB).
namespace arm {
namespace scb {
// Interrupt control and state register (RW)
static Reg32 &ICSR = Register<uint32_t>(0xE000ED04);
// Configurable Fault Status Register
static Reg32 &CFSR = Register<uint32_t>(0xE000ED28);
// MemManage Fault Address Register
static Reg32 &MMFAR = Register<uint32_t>(0xE000ED34);

//// Register subfields
// CFSR
// 1 if MMFAR has valid contents
const uint32_t CFSR_MMFSR_MMARVALID = (1 << 7);
// 1 if fault occurred during FP lazy state preservation
const uint32_t CFSR_MMFSR_MLSPERR = (1 << 5);
// 1 if fault occurred on exception entry
const uint32_t CFSR_MMFSR_MSTKERR = (1 << 4);
// 1 if fauly occurred on exception return
const uint32_t CFSR_MMFSR_MUNSTKERR = (1 << 3);
// 1 if a data access violation occurred
const uint32_t CFSR_MMFSR_DACCVIOL = (1 << 1);
// 1 if an eXecute Never violation has occurred
const uint32_t CFSR_MMFSR_IACCVIOL = (1 << 0);
} // namespace scb
} // namespace arm
With any modern compiler, these constants will be nicely inlined, resulting in
zero runtime overhead compared to the old-school #define method. Depending on
how you like to write your code, either method will work just as well; this is
more a personal preference point than anything else.
Hopefully some of this information comes in useful when debugging your own embedded projects. As ever, a Github repo containg some example code is available here.